Trading the stockmarket (NO Referrals)

Soldato
Joined
13 Jul 2004
Posts
20,079
Location
Stanley Hotel, Colorado
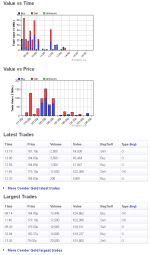
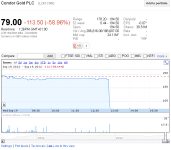
Official blip allegedly. Someone sold 5 shares at 70p or something off. I wouldnt mind 70p just the news that caused it.
Look up the trade list for today

KrmzV.png

177.00 - 185.00 (GBX) at 13:50:26
on Market (LSE)

sell quote said:
CONDOR GOLD PLC ORD GBP0.20 at a price of 177.85p

Hrm, nasty 15k worth of typo. Someone messed up I guess

VsBVB.png
 
Last edited:
Soldato
Joined
13 Jul 2004
Posts
20,079
Location
Stanley Hotel, Colorado
Just got a kick-out from a structured investment. 10% for a year which isn't bad.

Personally I won't be investing anything more in the stock market. I'm expecting a big crash next year.

A big crash needs a good rise in currency value, at least long term. We are screwing up cash, Japan printing even more today is reason market is happy
The BoJ said it would boost its asset-buying and loan programme by Y10tn, about $127bn, taking the total to Y80tn.

Value decline, price up. But I pretty much agree, a reset of some kind from the shock is likely so I would like to sell all trades and hold long term shares only [ Own some gold if you see a crash because that is undervalued vs cash issued]

What was the code for the product


Mentions XEL, dont know if I like this guy but its possible he is in the right area even if not brilliant himself

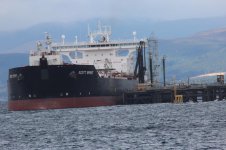
Pic of XEL's big boat full of flowtest oil, have they cancelled that 15% loan note yet. I'll not expect equity to rise otherwise
f2nbK.jpg
 
Last edited:
Associate
Joined
18 Oct 2002
Posts
392
Location
Up North
I posted earlier on my phone but can't see that the msg attached.....
Bucking the trend of most I sold out CNR yesterday, took a small profit after sitting on a loss for a long while. Its going into the utilities for the lovely steady divvies, ive done best here! Might shot a few quid back in soon though, gluten for punishment :p
 
Soldato
Joined
12 Jan 2004
Posts
6,824
Location
Londinium
Some points from Mark's Condor presentation in London last night (from LSE):

1. 12 month target for la India - 3m oz resource with 1m indicated. MC’s exact words – should "easily able to hit".

2. Fast track to open pit mining now there is almost 1m oz open pit.

Not discussed with the board but MC feeling is fast track to open pit. Target 100k oz pa mill.

3. Prove additional open pit resources... Start trenching America vein to see if it mirrors la India for open pit opportunity.

4. PEA within 60 days.

Additional comments:

1. Changed from JORC to CIM for North American investors. 43-101 report out within 30 days.

2. Further drilling to prove up 3 veins: Mestiza, America and la India

3. El Salvador not getting any better

Questions asked:

1. Environmental issues – obviously need to address and meet all international standards but cyanide is used by 3 other producers in Nicaragua.

2. Open Pit v BFS – which is the chicken and which is the egg. Do we actually need to get to BFS and measured resources if we can move enough to indicated to get the funding we need.

3. Do we have what we need to go to production – no we would need a serious miner who has set up a gold mine

4. Canada listing? – in no hurry, not for next 6 months, but would like to attract Canadian fund managers who would be happy to buy in London listed shares if the story is good enough.

---

Fast track to production? Yes please! Once the company becomes self funding it will be a major game changer for us. Also I suspect that once the drills start turning again, 3m oz will be easily achieved and much sooner than sept next year, especially when the old mine is reopened (very high grade), which wasn't fully mined out before the mine closed due to flooding.

Multiple high grade open pits across La India is also very exciting. Once the PEA is out we should have an idea of the real economics of hosting a 100k oz pa mill and get an idea of the average costs per oz. If it's significantly cheap (and all evidence so far points to this) and considering 4m oz across la india should be achievable then that should get the big miners very excited, I suspect offers will start coming in before too long.

It's all very exciting!
 
Soldato
Joined
13 Jul 2004
Posts
20,079
Location
Stanley Hotel, Colorado
FTSE 5368.41
S&P 500 1216.01

This year it's far too high and with what I said.

I looked at one with socgen with similar pay off conditions. It was a good bet
but now a normal tracker with a dividend would make more sense

XEL Flowtest of 147k over 2 months, if they got that normally and made $20 a barrel that'd make them about 17 PE now. Though I might be completely wrong

112p is pivotal area, lots of volume I think but its sold with lots of volume too so will need to rebuild


3. El Salvador not getting any better
Sal is tied to the dollar. If dollar goes down, I think that will mean they need the mining trade more. So long as they dont just seize assets, it should become a nice bonus eventually. Problem is how long to get that mine going with a late start

FRES vs RIO
 
Last edited:
Associate
Joined
18 Apr 2006
Posts
1,069
Location
Essex
Anyone calculated their actual returns?

I have been keeping my monthly return on capital for the last couple years on a monthly basis since doing this full time as a proprietary day trader and it is really instructive - it makes for interesting reading (well for me, anyway :p).

February seems to be my second worst month (relatively speaking) with the worst spread around (August 2010 holiday, June 2011, January 2012) so far. Average (simple) trading costs are 6.57% of profit - highest month is 9.6% and lowest is 2.05%.

2010 ROC was reduced by an absolute 58.5%, 2011 by 94%, and to August 2012 by 68.53%. Note this is an absolute figure not a percentage of the total profit which as I said above is an average of 6.57%.

Big months tend to have lower costs and this seems to point to the big chunky trades being a lot more profitable than some of the larger profit generating smaller trades where the costs mount up. I have on the odd occasion had profitable trades land up being breakeven or small losses as the exit trades were always small little odd lots (yes even large caps sometimes trade in annoyingly small amounts as the increasing use of algorithms promotes this).

The lowest monthly return (admittedly I was on holiday for two weeks :cool:) is a 33.33% of my average and my highest is 221%. In terms of consistency, 30% of my monthly returns are 75% or below my average and 30% are 25% or above my average which, on the face of it, makes sense being a simple average.

However, this disguises the fact that one goes on holiday, public holidays, is ill or has things to do that can eliminate a day. For example, I hate going to an appointment after 07h30 of before 16h30 because, (at 11h00 for example :eek:) this means not trading before that time as you may not have exited by appointment time and of course the time of the appointment, driving back to your desk and actually finding something afterwards). So the fact that ONLY(!) 30% are 25% below the average shows some consistency which I am happy about bearing in mind each day lost is 4.5% of a month (1/22)

I was wondering if the rest of you keep records and have an understanding of your actual ROC, costs, monthly vagaries etc that have thrown up any interesting nuggets?

Noughtboy
 
Wise Guy
Soldato
Joined
23 May 2009
Posts
5,748
Seems like if an Iran war is inevitable soon, perhaps defense stuff might be a good buy. General Dynamics, Raytheon, FLIR, SAAB, etc.

Anyone thought about this?
 
Soldato
Joined
13 Jul 2004
Posts
20,079
Location
Stanley Hotel, Colorado
Yes I own BAE and they pay a good dividend which isnt that risky afaik. Questor has written on them and defence generally. Possible merger

Budget cut backs hardly bode well but the world is not especially peaceful either. I dont see Iran war as likely

Rolls royce is much simpler but related. The turbines have multiple uses

XEL sell at 130 was good though Im not sure why they should fall really. Bought back back here, see if they can hold or not.
Oil is down a bit and markets can fall this week I think


Kurdistan - The News We Have Been Waiting For….Isn't It?: There has been a lot of news flow and attention paid on the potential restarting of payments to Kurdistan for its exports, which was almost certainly leveraged by the Kurdistan Regional Government's ("KRG's") announcement that it intends to construct its own export line to Turkey, which in turn was precipitated by Turkey's announcement that it would accept crude from Kurdistan. This is certainly good news for operators in the region, but there are still clouds on the horizon, as it is not a definitive enduring agreement, the payments will not be clear of restriction (potentially to $650mm) or caveat (that is has to be according to Iraqi Law, which decrees that the KRG's valorisation of its oil is illegal), nor did it come without an attendant sabre rattle (that Kurdistan owes Baghdad ~$9bn for oil it has produced and sold without Baghdad's blessing). While care needs to be exercised, this is a step in the right direction and it will give the KRG room to manoeuvre while it adopts a belt and braces approach, and should provide further support for the region's participants, which most notably for UK investors are Gulf Keystone, Afren and Gene
 
Last edited:
Associate
Joined
18 Apr 2006
Posts
1,069
Location
Essex
Morningstar do a portfolio, gives a monthly graph. There is probably much better though

MJTkk.png RbEWe.png

That is not what I am referring to. Those are all stocks in your current portfolio...I am asking about a running total since you have starting trading as opposed to a per stock performance. Additionally, that does not look as if it takes account of trading costs only an entry price and current price.

That also does not show if you are long or short a stock.

NB
 
Last edited:
Soldato
Joined
3 Aug 2003
Posts
15,917
Location
UK
Google finance do what you are talking about I think.
I had a portfolio set up in there a year or so ago. Seemed pretty useful.
 
Associate
Joined
18 Apr 2006
Posts
1,069
Location
Essex
I think we are talking at cross purposes. Let me illustrate what I am talking about by way of example:

Jan 2012; Capital £1000. Trading profit £100 (10%) Trading costs £10 (10% of profits) ROC £90 (9%)

February Capital £1000 Trading profit £125 (12.5%) Costs £20 (16% of profits) ROC £105 (10.5%)

% ROC 22.5% Total Costs 13.3% of profit (£30/£225) Net return 19.5% [(£90+£105)/£1000]

This way you can see how profitable your trading has been over the period of time not the "return" on your current shareholdings which I never have because I close out every day.

Does that make sense? Essentially, I suppose it is to get you traders thinking of whether your are profitable and treating your trading like a business or taking a "flutter, like". At the end of the day, if it is not profitable...

Noughtboy
 
Last edited:
Soldato
Joined
13 Jul 2004
Posts
20,079
Location
Stanley Hotel, Colorado
So you use paper and pencil now ? Some use MS Money, I guess excel can do this or anything but its the look up function on prices most want as investors

Morningstar does cover costs, my image was unrelated. If you daytrade isnt it all about spread anyway

Petra Diamonds rose 20% since Thurs, great but I decided against over investing which had been my specific plan opps :o

CNR is considered a good buy into infinity pretty much :p 165 can be bought. 200 was a fair top I thought.
The old price to buy was 6p or 120 now, anywhere close to that I always used to top up but apparently they have improved resources or NAV since then
Gold just keeps on its 2012 high which is either a reason to buy now or be a sceptic and wait till it falls again and flushes out those uncertain on it

AAZ is a gold miner too cheap for some reason apparently 5 PE

Based on previous high lows i would guess 163 for CNR to rest and I think 120 is a fair place on PDL right now though it is strong. I'd like 150 or 200
I bought VED also ERE though my timing may be way off, there is hope of reform in India


Get your complimentary copy of The Naked Trader

caveat emptor
 
Last edited:
Associate
Joined
18 Apr 2006
Posts
1,069
Location
Essex
So you use paper and pencil now ? Some use MS Money, I guess excel can do this or anything but its the look up function on prices most want as investors

Morningstar does cover costs, my image was unrelated. If you daytrade isnt it all about spread anyway

Well, I don't know how to use that Excel thingy :confused:

Seriously, I know it can be done (I do it myself in that Excel thingy :D) I am asking if the day traders are doing it and keeping a watch on it and what, if any, pearls they have found out about their trading style or pattern? For example, some people land up overtrading trying to chase a penny here or there and don't cover the costs etc despite making a "profit". Or a more specific one like I have often been on the wrong side of SAB Miller - I have mostly made money on it but also made my largest loss on it. This means that I now usually take any SAB profits off the table too quickly because I am wary of a sudden turn putting me over a barrel :eek:.

As to spreads, I don't pay a spread* per se as I am a prop trader and deal directly in the market. So essentially I just pay my per hit cost which mostly works to my advantage as I generally do larger trades but sometimes, as I mentioned, works to my disadvantage if the entry or exit or both land up being piecemeal bits of stock.

I will land up doing the maths soon on whether to stay on a per hit deal or try to move to a per order strategy.

Noughtboy

*other than the obvious market bid/offer spread but no additional "broker" spread.
 
Back
Top Bottom